Snapshot provides powerful tools that visualize metadata dependencies and construct entity relationship diagrams.

Snapshot’s Impact Analysis Report gives you a high-level view of how the assets in your org are connected. You can browse through the metadata dependencies and construct entity relationship diagrams. You can see how the metadata assets in your org are connected. If you select an asset that is going to be changed or deleted, you can see the other assets that it depends on, and how they will be affected.

The Report works with all 250 different Metadata Types and is aware of over 1200 different relationships. This is by far the most comprehensive coverage of any impact analysis report or dependency API on the Salesforce platform. This whitepaper starts with an explanation about how to use the Impact Analysis Report. After that, we present some specific use cases.
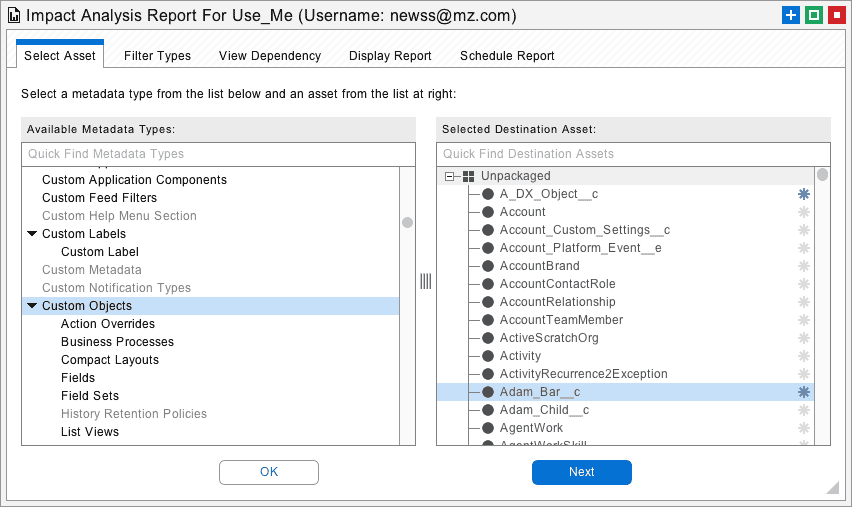
The first screen allows you to select any metadata asset. The left-hand list has the different asset types, and the right-hand list has individual assets of that type. The asset you select will be the starting point for the report. For example, if you were conducting an impact analysis, you would select the asset that you want to change. If you are building an entity relationship diagram, you might select the central entity that you want to build the diagram around.
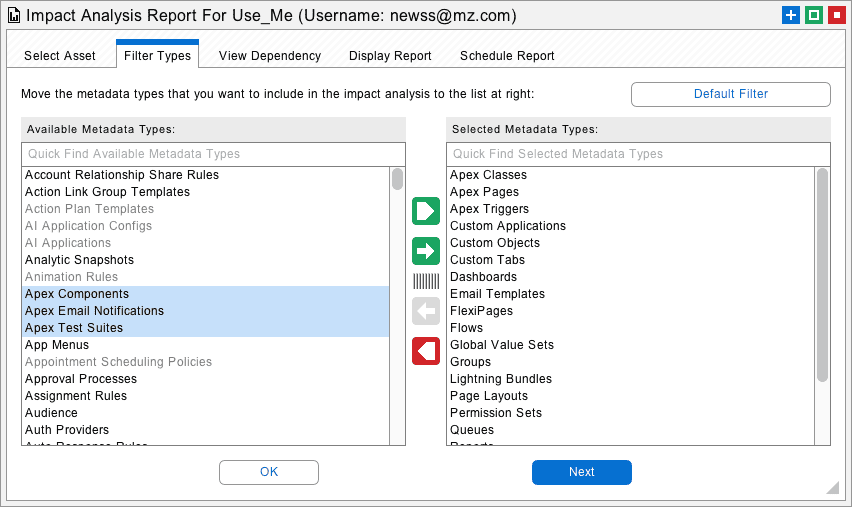
The next tab shows the metadata types that are included in the report. The list at left is all available types, and at right are the selected ones. There is a button at the upper left that will reset the selection to some common metadata types that are often connected. There is nothing wrong with including all metadata types in the list. The items in gray are not available in the current snapshot, but they can still be included in the report if desired.
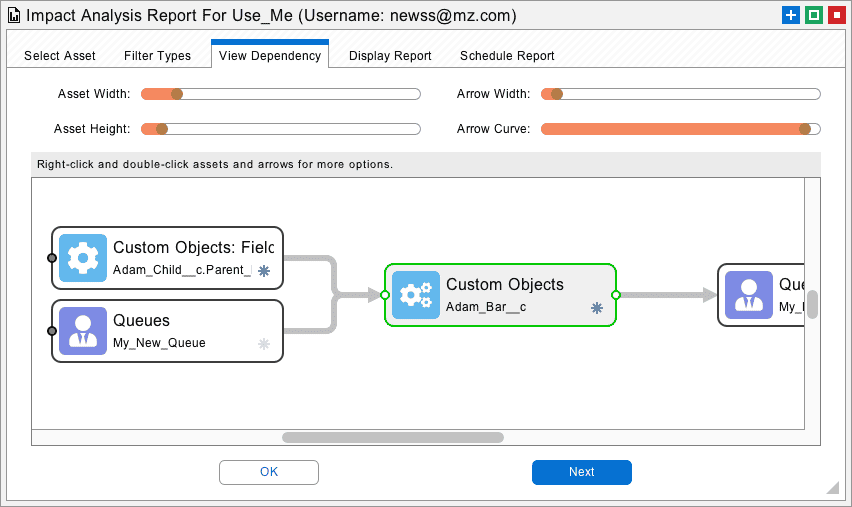
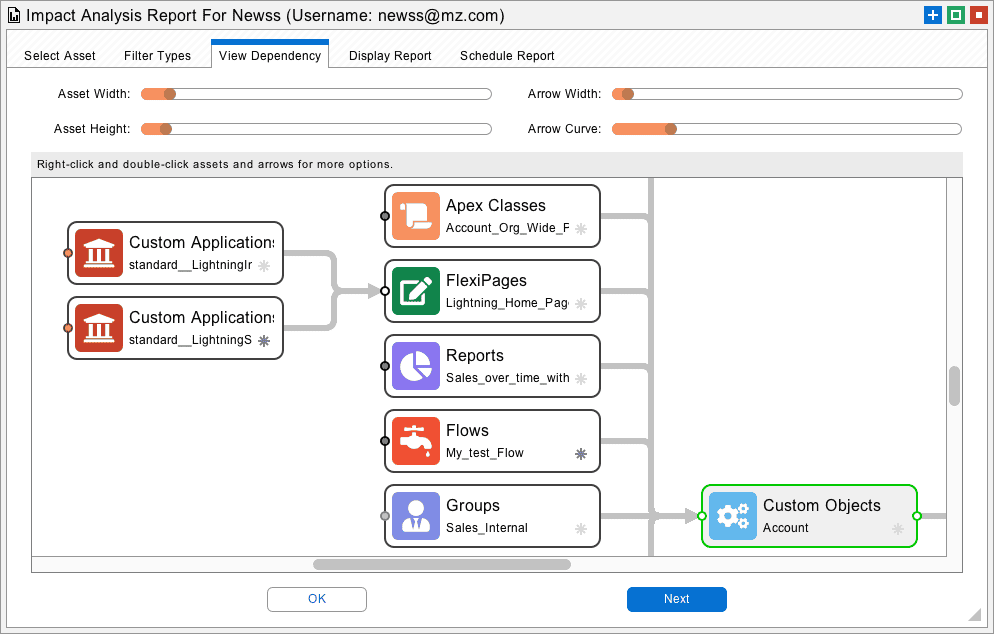
The next tab shows the entity relationship diagram. The selected metadata asset will appear in the center of the screen and has a green border marking it as the starting point. Assets that refer to the selected asset will be connected to the left. Assets that the selected asset refers to will be connected to the right. This is an important capability: the Impact Analysis Report can show the assets that the selected asset is dependent on and related to in the same interface.
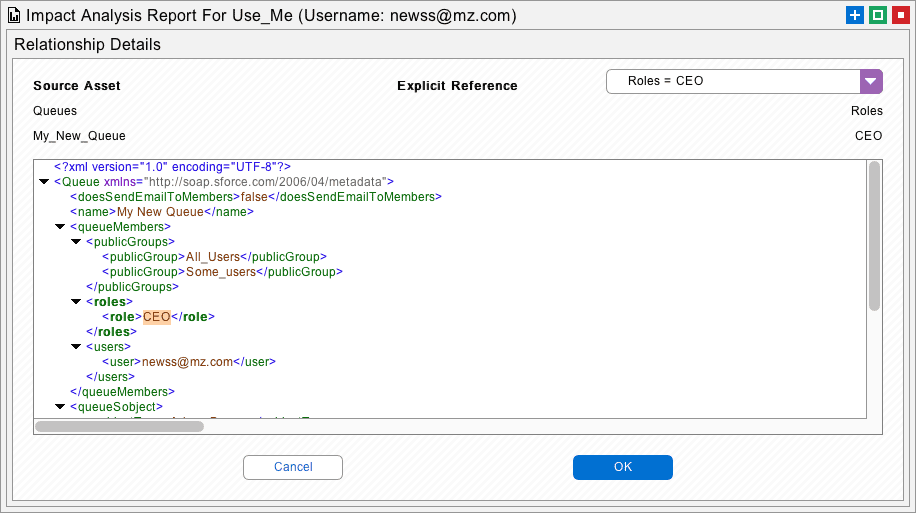
In this case, there is a Custom Field at upper left that has a reference to the Custom Object in the center. The Custom Object in the center has a reference to a Queue at right. What this really means is that the Custom Field holds a reference to Adam_Bar__c. If you look at the XML for the Custom Field, then you will see that name there in the referenceTo element.
The Custom Field refers to the Custom Object, and the Custom Object refers to the Queue on the right. These are direct relationships. But you can click the little dots to the left or right of the asset tiles and expand the tree farther in either direction. More and more assets will appear, depending on where you explore. These assets will have an indirect relationship to the starting point.
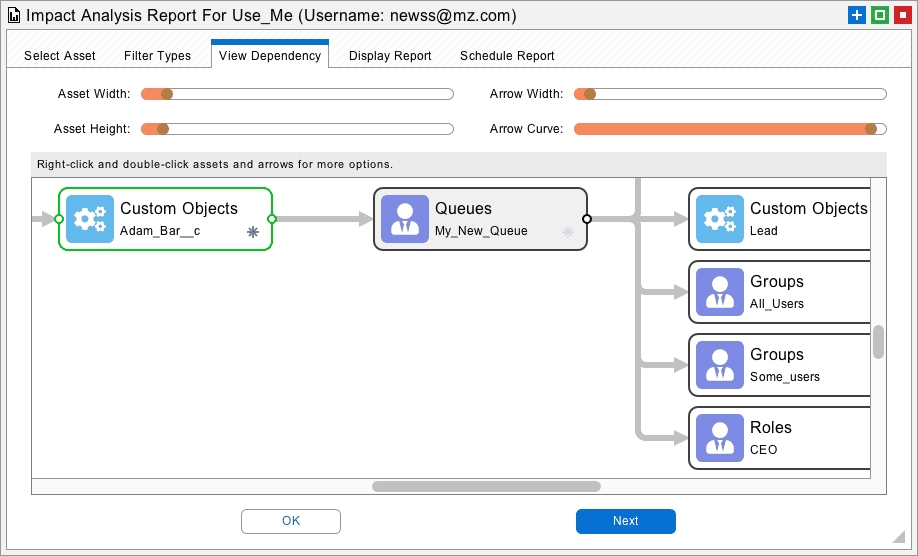
You can double click any of the assets or arrows, and the Relationship Details Dialog will appear. This dialog will show the asset that you clicked on and the direct relationships to the right. For example, if you double-click on the Queue above, then the Relationship Details Dialog will show the connected asset at right and how each one is connected.
You can right-click any of the assets, and more options will appear from the pop-up menu. The first five options let you interactive browse the entity relationship diagram.
The next two options are just like clicking on the expand/collapse buttons.
The next three options create a red path from the selected asset back to the starting point. This is useful for seeing how any asset is related to the starting point.
The next three options are for exporting things. Export Asset will export the selected asset as a file suitable for a developer project or online repository. The Export Picture option will save a picture of the entire entity relationship diagram to the desktop.
The Export Job List option will save a Job List to the desktop starting with the selected asset and including all of the connected assets to the right. These are the related assets that must be included to deploy the selected asset.
Lastly, the Relationship Details option will bring up the Relationship Details Dialog just like a double-click. You can also right-click and double-click the arrows for similar options.
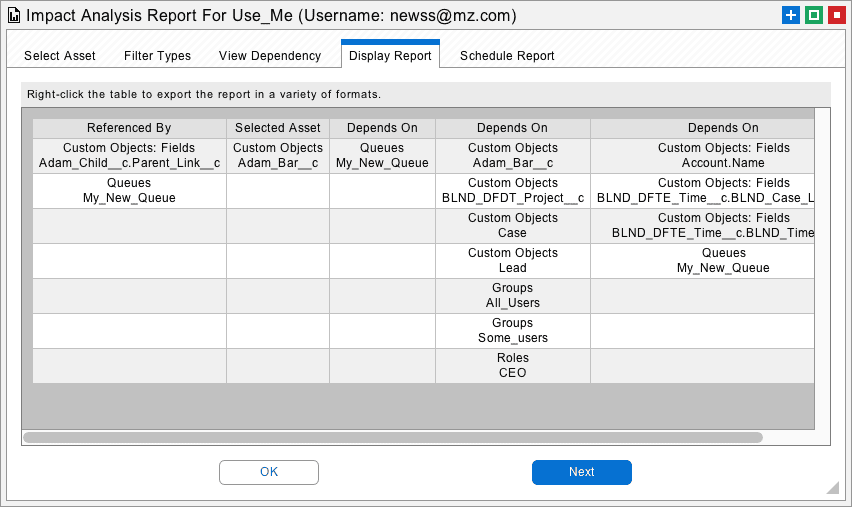
The next tab shows the entity relationship diagram in report format. All of the assets that are related to the selected asset are visible to the left and right. This report can be exported in many formats, and as usual, all reports can be scheduled as an automated workflow with the last tab. The next part of our whitepaper discusses some common use cases for the Impact Analysis Report.
If you are wondering how any part of an Org is structured, then you can use the Impact Analysis Report to explore the various relationships involved. At any time, you can select a new starting point with the Go Here right-click option. Using the view stack, you can also jump back to the previous starting point. This is useful for figuring out difficult deployment scenarios as well. When you get the right tree of asset dependencies, the Export Job List option can create a text file that can be imported into the deployment tools.
Another useful application of the Impact Analysis Report is building Entity Relationship Diagrams. Start with an asset that is central to your diagram and expand out the tree as needed on each side. When the picture explains the relationship that you want to document, save the picture. The pictures can be archived as documentation or incorporated into presentations. The sliders at the top of the View Dependency tab can be used to control formatting of the image prior to export.
Lastly, if you are planning on changing or deleting any asset then you can select that as the starting point and see the impacts involved. Assets that reference the selected asset are on the left. If the selected asset is deleted, then the assets to the left must also be deleted or perhaps reassigned. The selected asset will reference assets to the right. If the selected asset is deployed, then the assets to the right must also be migrated.
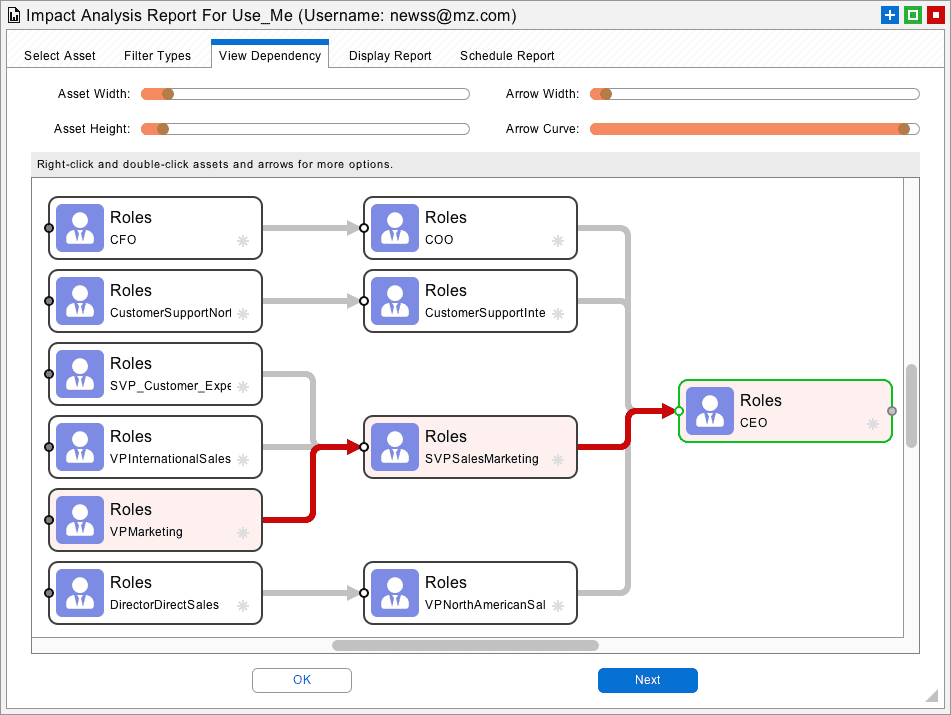
Here is a nifty example of using the Impact Analysis report for User Roles. The entire Role Hierarchy can be expanded into an org chart. This report is like Snapshot’s Relationship Hierarchy Report, but sideways. Various Sharing Rules are related to the Roles, so we used the Asset Filter to remove them and focus on the Roles alone.
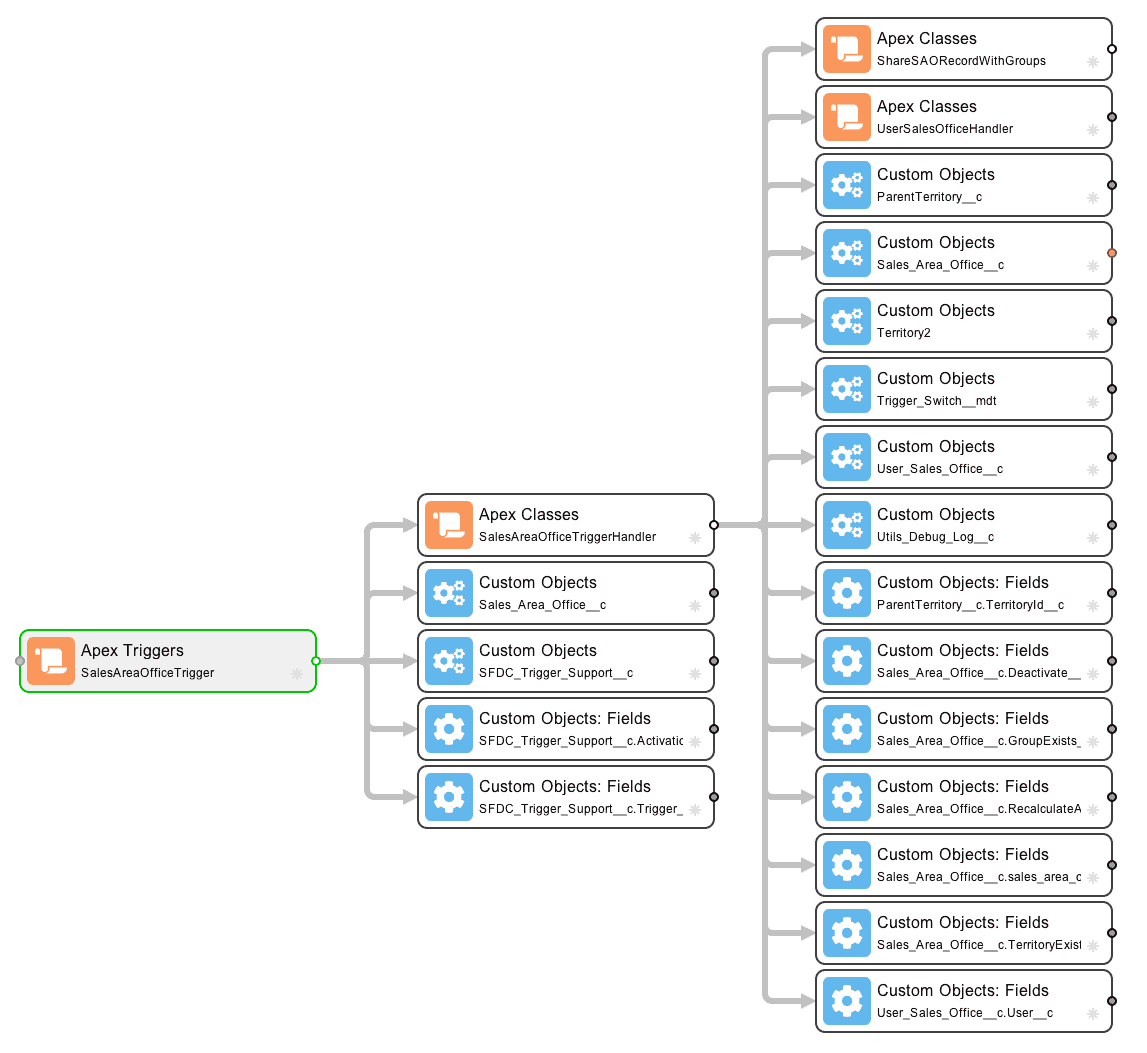
Here is another extremely useful application of the Impact Analysis Report. You can see how the starting point Trigger calls an Apex Class, which calls another Class, which calls two more Classes, and all of the Custom Objects and Fields that they reference. This report would be useful for application development to see all of the references in the code to multiple asset types. This view is also great documentation that shows which Custom Objects and Fields are impacted when the trigger is fired.
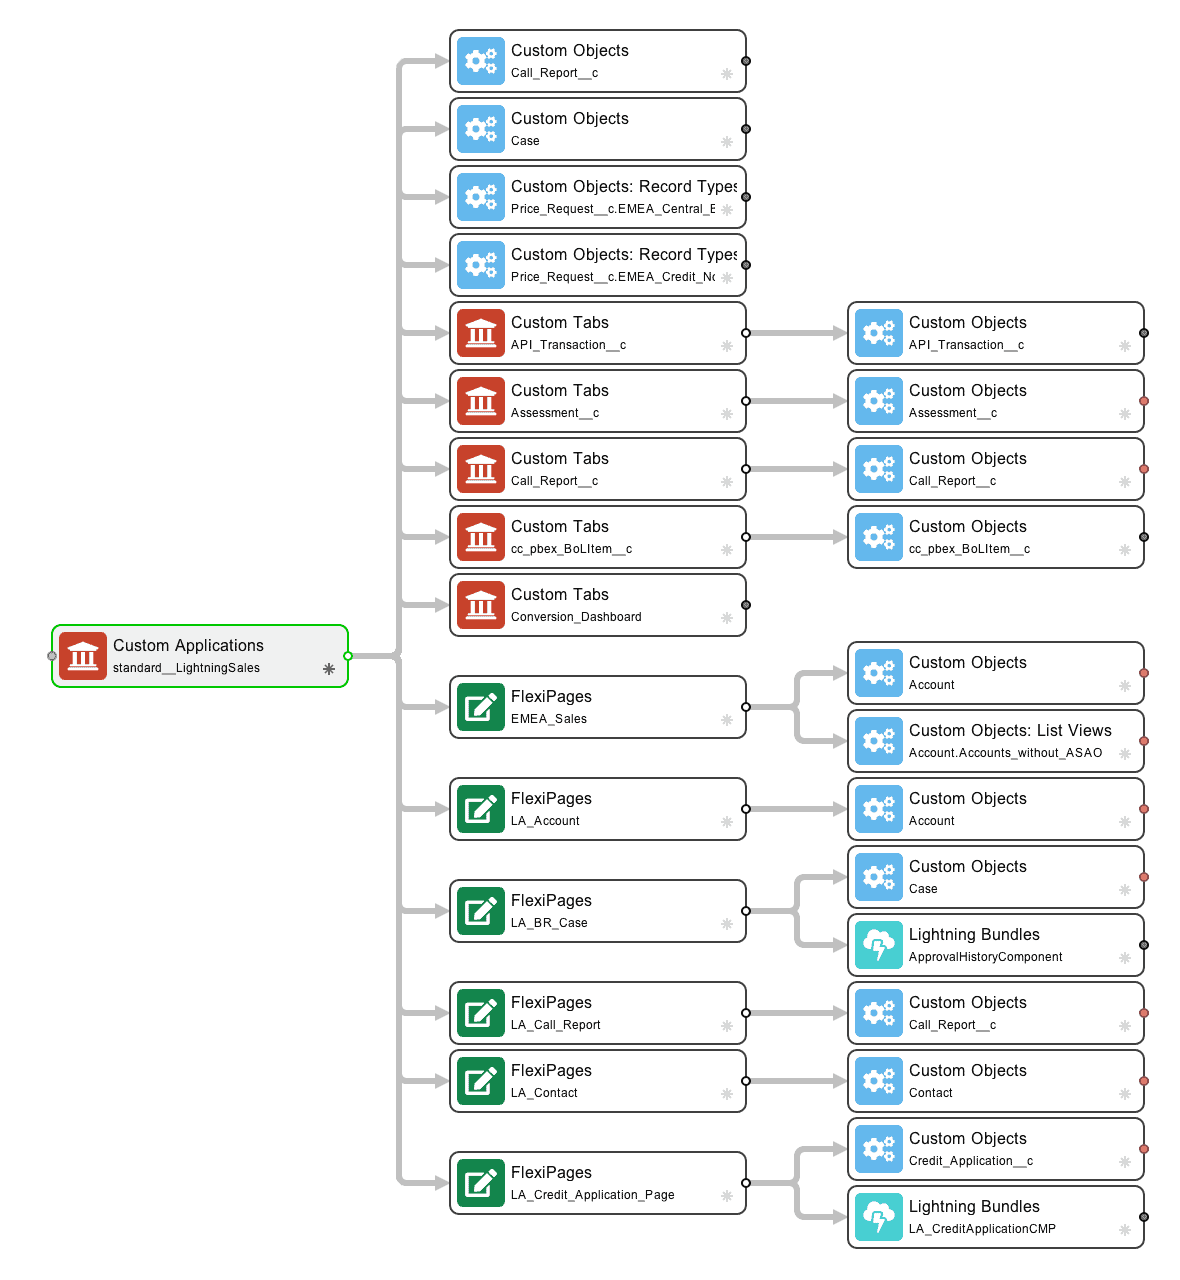
One of the most useful starting points for the Impact Analysis Report is Custom Applications. These assets reference many other asset types, including Custom Tabs, Custom Objects, Custom Fields, FlexiPages, and Lightning Bundles. Custom Applications have taken on new important under Lightning Experience, where the actionOverride and profileActionOverride elements define the user interface. This structure is revealed below.
This white paper has discussed some of the use cases for the new Impact Analysis Report. This report works with all 250 different Metadata Types and is aware of over 1200 different relationships. You can really start to understand how your Org is structured by browsing around the entity relationship diagrams. The Snapshot product from Metazoa provides a best-of-breed solution for Impact Analysis through this comprehensive coverage of Metadata Types. Click the download button to get the pdf version of this whitepaper. There is also a case study available for impact analysis.
 Congratulations!