Org monitoring is easy to set up and very customizable. You can watch any number of orgs and send out alerts if problems are detected.

One of the most useful things that you can do with Snapshot is to monitor the status of an org. This is simple to set up and only requires a Workspace with one item. This whitepaper shows you how to set up automatic Snapshots, create Org Management reports, and then send out alerts if there are problems. First, let’s take a look at how to create a Snapshot item.

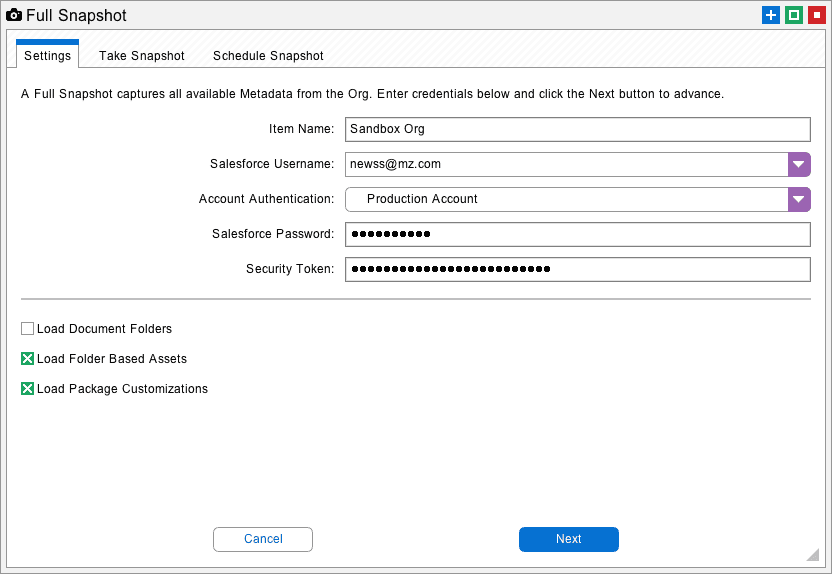
Start out with a new Workspace and drag a Snapshot Item onto the desktop. Right-click the item and select the Full Snapshot option. Enter the credentials for the org you want to monitor and click the Next button.
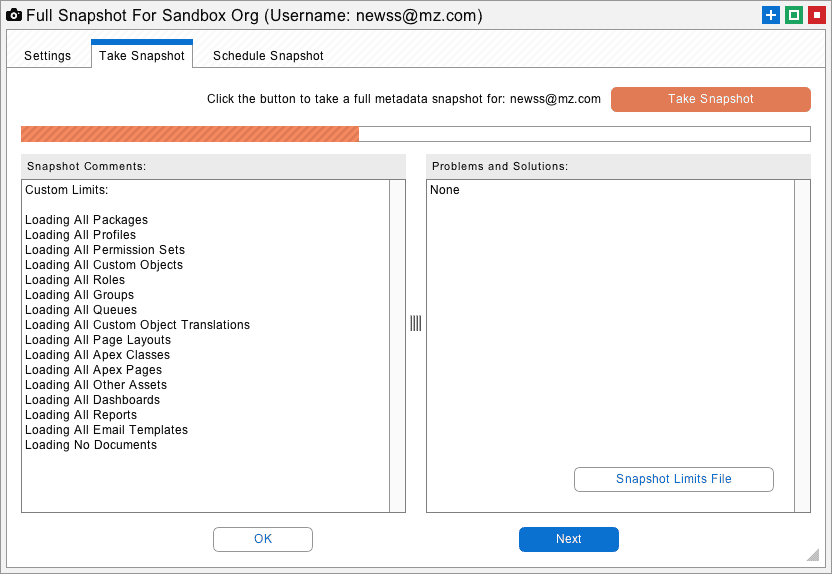
On the next screen, click the Take Snapshot button. At this point, Snapshot will create a comprehensive schema and metadata picture of your org. This information is stored on your local hard drive. Every new Snapshot will be added to the Time Series of information about your org.
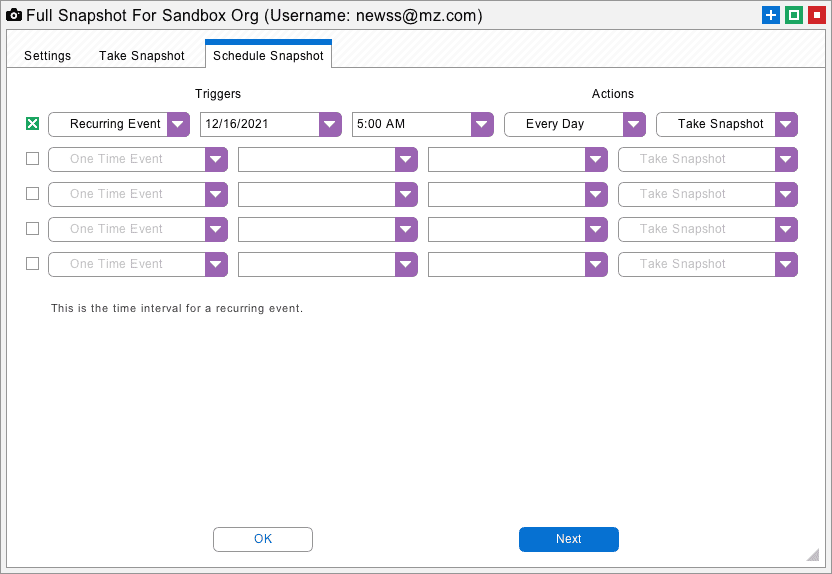
When the Snapshot is finished, be sure to go to the last tab named Schedule Snapshot. This allows you to pick a time to automatically take additional Snapshots and add them to the Time Series. For example, you might want to schedule a Snapshot every month or every week. You could even take one every day. We recommend taking automatic Snapshots at night when demand for Salesforce is low and employees are not using the org. Here is what your last screen might look like, below. Click the OK button to remember the Schedule and return to the Workspace.
Now, if you click the Runtime button at the top left of the Workspace, Snapshot will go into Runtime Mode. As you can see from the Event Schedule at lower left, a new Snapshot will be taken every day, or whatever period you specified. In terms of compliance, security, and governance, what you have already accomplished is huge. Snapshot has been set up to record a comprehensive schema and metadata picture of your org over time. This can be used to restore metadata if there is a problem and provide historical reports on how your org is changing. If you click the Test button on the Event Schedule, another Snapshot will be taken.
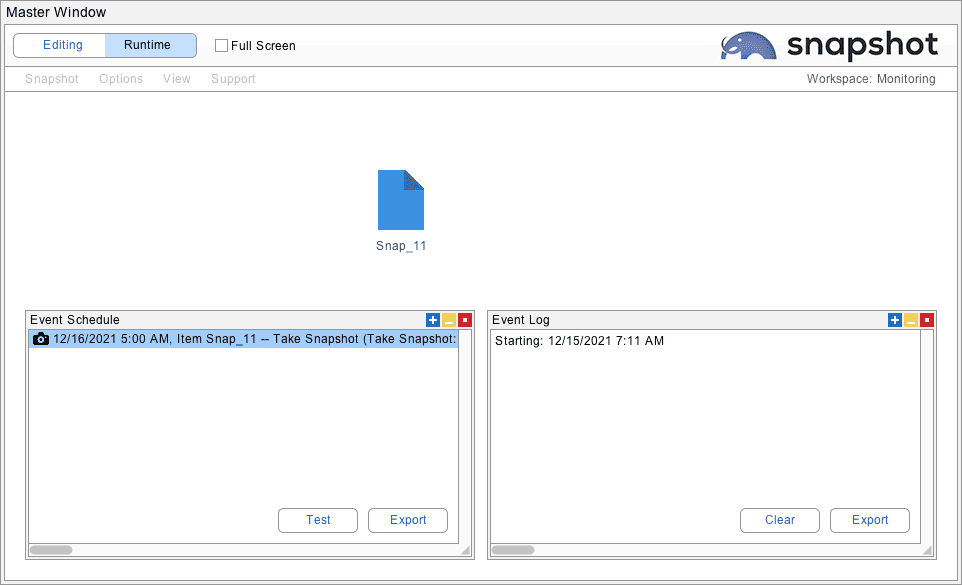
Snapshot can only conduct Org Monitoring and reporting when the client executable is in Runtime Mode. Some customers click the Runtime Mode button when they leave for the evening, or you can set up the Snapshot Application on a desktop or Cloud Virtual Machine that runs in the background. This is easy to do, let us know if you have any problems.
Before we talk about how to add Org Monitoring reports to the Snapshot, we need to be sure that your Snapshot Preferences are set up properly. You can define different ways to notify Admins or store the reports that are generated with the Snapshot Preferences dialog. First, select Snapshot Preferences under the Snapshot Menu, and the Preferences dialog will appear.
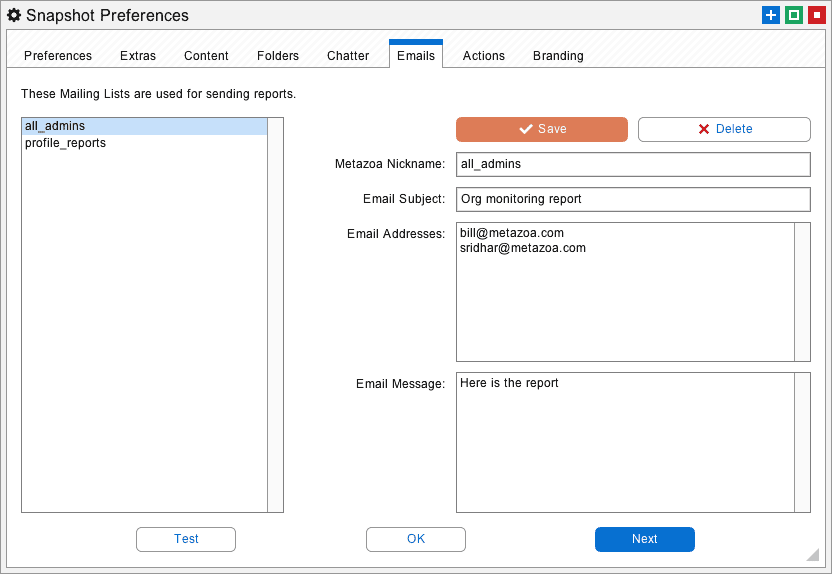
As you can see in the picture above, I have created a Mailing List for sending out report information. The nickname for my mailing list is called Admin, this name comes into play later on. Anyway, you can store reports as Salesforce Content or Local Folders, and you can send messages with Salesforce Chatter or Email Attachments. I suggest setting up a Mailing List at first. You can also click the Test button at the lower left to make sure that your Mailing List (or any of the communication methods) is working. By the way, the last tab will let you add a custom logo for branding your reports if desired.
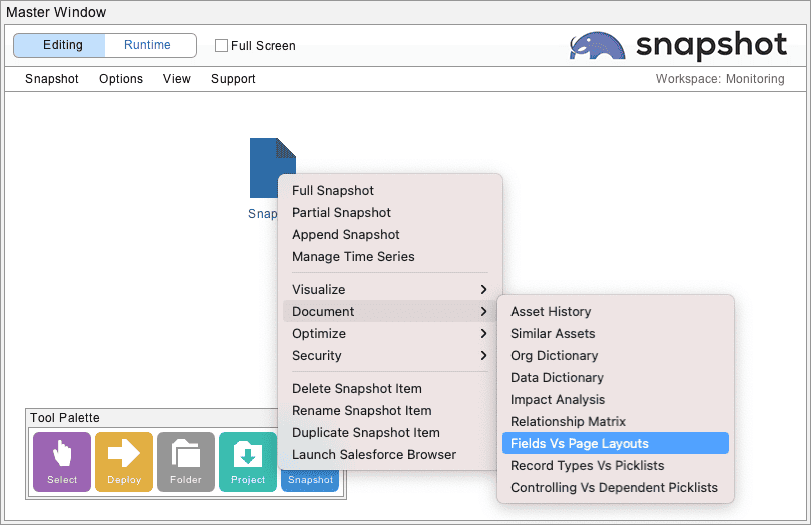
The information in the Snapshot item can be used to generate over 50 different reports on every aspect of your org. Let’s take a look at how to add additional reports to the org you are monitoring. Right-click the Snapshot desktop item, and you will see the reports that are available under the Document, Optimize, and Security sub-menus. Let’s choose the Data Dictionary report as an example. This report can fully document all of your Objects and Fields for compliance and security.
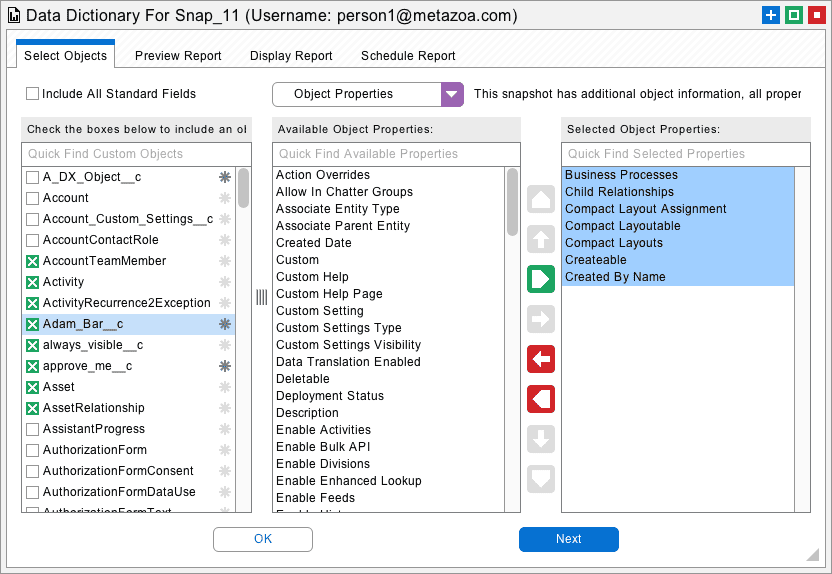
In the Data Dictionary report dialog, you will see Custom and Standard Objects at left, and a variety of properties that can be added to the report on the right. Select various items and check out the results in the Preview Tab. Check multiple objects and all of them will appear in the Display Report tab. In this manner you can quickly assemble a fully customized and comprehensive report on all the Objects and Fields in your org. The picture below shows an example setup for the Data Dictionary.
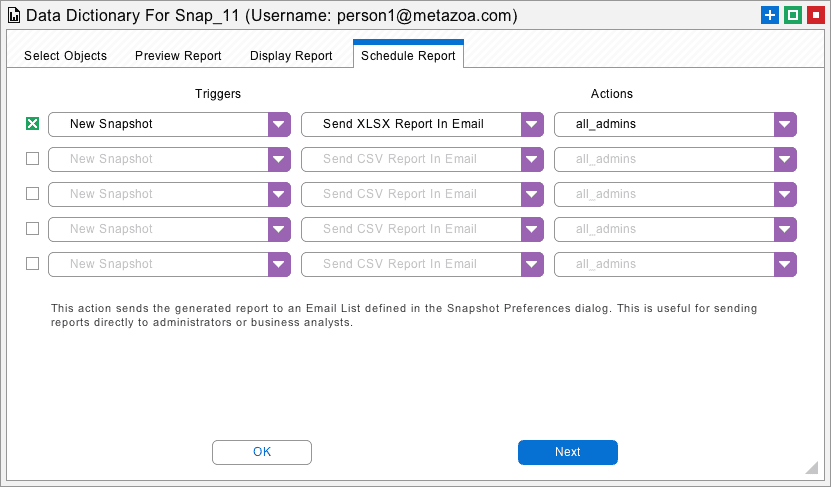
Just like the Take Snapshot dialog, the Data Dictionary has a Schedule Reports tab. Go to the last tab, and you can use the New Snapshot event to trigger a new Data Dictionary report whenever the Snapshot metadata changes. The report can be in CSV, HTML, PDF, or XLSX format. The report can be sent to any of the nicknamed groups that you have created in the Preferences Dialog. In the picture below, I have chosen to send the report as an Email Attachment to the Admins Mailing List that I created earlier.
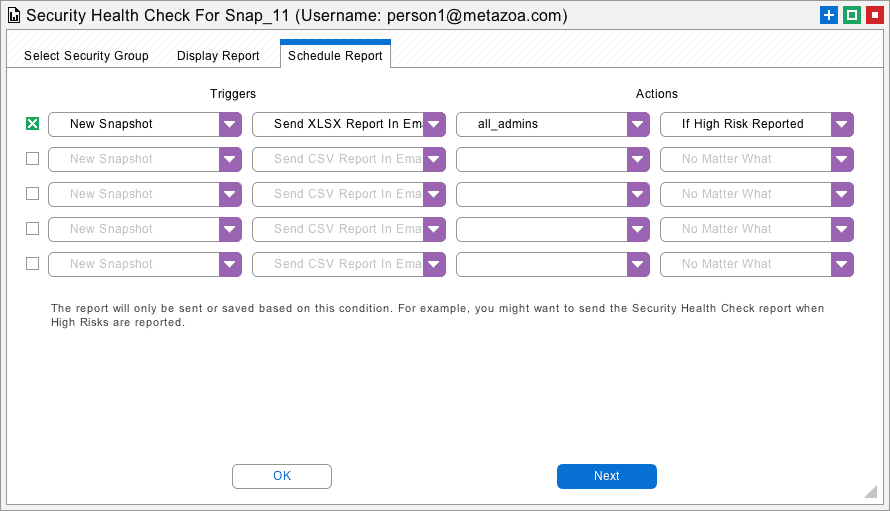
Some Snapshot reports have triggers. The trigger can be used to send the report out only when there are problems. This is easy to set up. Let’s take a look at the Security Health Check report. On the last tab you can schedule the report to be sent if high risks are reported. In this manner, your Org Monitoring setup can be used to notify the appropriate team members when real problems are happening with an org.
Now finally let’s take a look at some of the best Org Monitoring reports that you can set up with Snapshot. Here is a partial list of what is available. Simply select the report by right clicking the Snapshot item. Play around with the report, and if you want to use it for Org Monitoring then go to the Schedule Report tab. When you go back to Runtime Mode you will see all your reports in the Event Schedule.
Manage Time Series
Trigger an alert when any section of Metadata changes in your org. For example, you could watch Apex Classes and document the before and after differences when they change.
Data Dictionary
We have already mentioned the Data Dictionary which generates a comprehensive view of Objects and Fields for compliance and governance.
Field and Picklist Usage
Document the fields and picklists that are underutilized and might be candidates for decommissioning. Trigger an alert if there are problems.
Forgotten Assets
Examine over 50 different metadata types that might be disconnected, hidden, inactive, or simply not being used. Trigger an alert if there are problems.
Apex Code Quality
Run dozens of PMD Code Quality tests and trigger alerts if any of the code in your org has quality problems.
Apex Code Coverage
Same deal for code coverage. Pick the desired level of coverage and trigger an alert if there are problems
User Connection Cleanup
Monitor your org for inactive users that are still connected to important enterprise systems. Trigger an alert if cleanup is needed.
Salesforce Limits
Watch for situations where your org is getting near the limit for dozens of different activities like disk space, API transactions, number of fields, etc.
Security Health Check
Same deal for the health check information. Watch for security or health problems and trigger an alert if there are problems.
User Activity Timeline
Watch user activities in the org and send out an alert if something looks suspicious. You can define the activities that need to be watched.
Profiles and Permission Sets
Send out detailed matrix reports of Profile Permissions, Permission Sets, and Combined Security Reports by User for archive and compliance.
Now that you have a workplace set up for one org, adding any number of additional orgs is super easy. Just duplicate the original Snapshot item and log into the new org. Bingo! You are now monitoring the new org with all the same reports. Right-click the new org if you want to change any of the reports or notifications. In this manner, you can monitor all your production orgs including Sandboxes and Developer Edition Orgs in your deployment pipeline.
Snapshot can be set up on a desktop computer or virtual machine for continuous org monitoring. We suggest creating a shortcut that launches the Metazoa Player with administrative rights. This guarantees that Snapshot can write your reports to the local hard disk. If you include the command line argument “Runtime” then Snapshot will automatically log into the License Manager and go into Runtime Mode after that. If your shortcut launches the Metazoa Player on startup, then any time the virtual machine restarts Snapshot will go back into org monitoring mode. Here are some tips about setting up automatic org monitoring with Snapshot and the Metazoa Player:
Salesforce Org Monitoring is easy to set up in Snapshot and very customizable. You can watch any number of orgs for problems and send out alerts if they are detected. Let us know if you need help with org monitoring. Click the download button to get the pdf version of this whitepaper.
 Congratulations!